Link Tabular Data to Geospatial Data
About This Tutorial
Section titled “About This Tutorial”Note for Instructors
This tutorial gives an example to help students understand GIS technology allows people to connect data with geography. GIS can relate unrelated information by using location as the key index variable. Sometimes people don’t fully understand their data until they see how it relates to other things in a geographic context. And GIS can help people understand what belongs where.
Through this tutorial, student can get familiar with how to link tabular data to geospatial data by using ArcGIS Online. Instructors can add more exercises based on students’ need.
Download Data
Section titled “Download Data”The following steps show how to find geospatial data from BTAA geoportal and tabular data from U.S. Census.
-
Visit the BTAA Geoportal and search with the keywords
county boundary of Wisconsin -
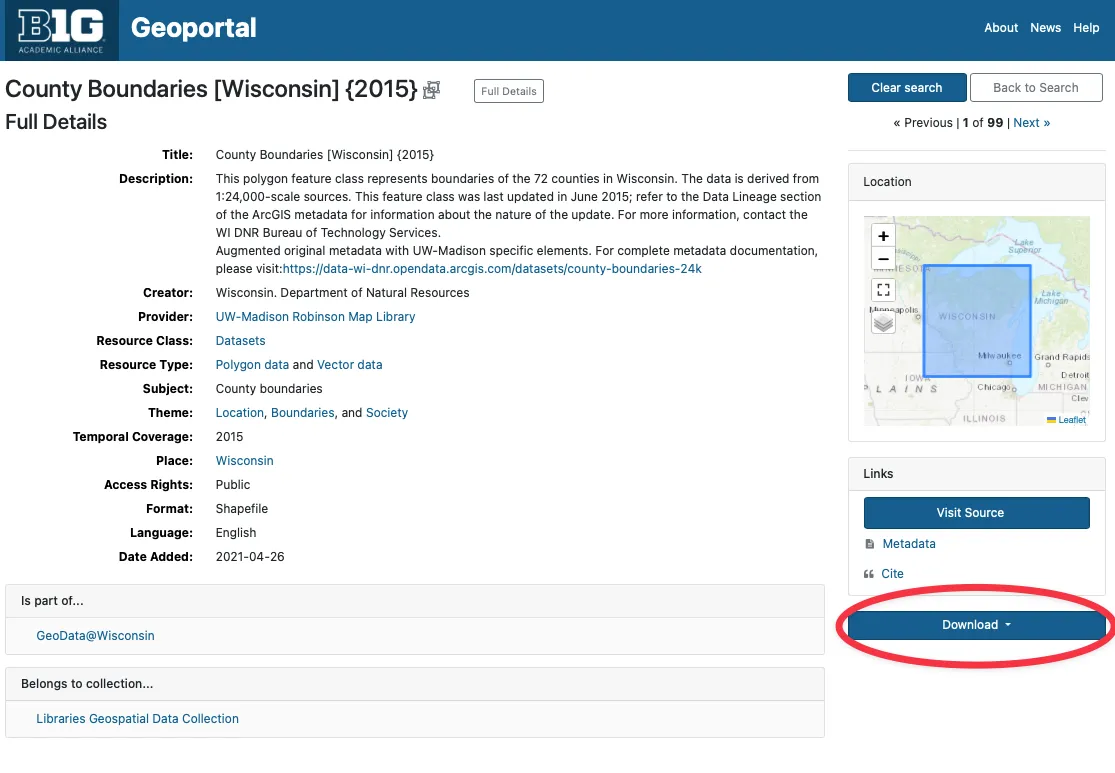
Open the result “County Boundaries [Wisconsin] 2015”
-
Click the Download button and select “Original Shapefile” to download the data. Save as “WI_Counties_2015.zip”. This polygon feature class represents boundaries of the 72 counties in Wisconsin. The data is derived from 1:24,000-scale sources. This feature class was last updated in June 2015.
-
Open the U.S. Census website and search the keywords
wisconsin counties by population -
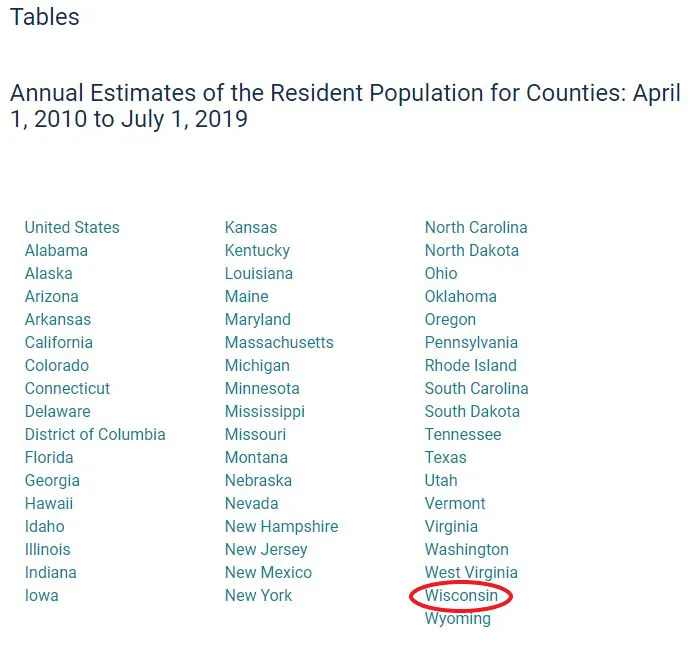
Open the first result “County Population Totals: 2010-2019” and click Wisconsin to download the table.
Prepare Data
Section titled “Prepare Data”-
Log into ArcGIS Online and create a Web Map
-
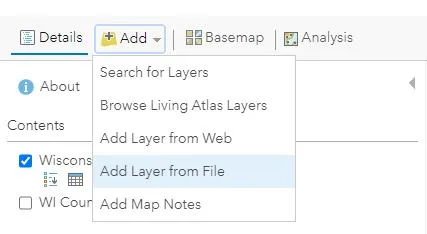
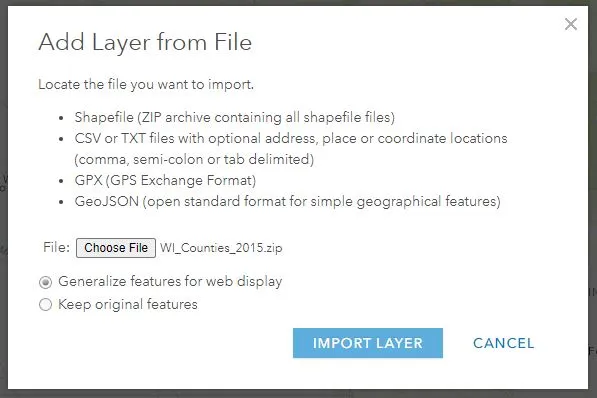
Add WI_Counties_2015.zip as a new layer from File
-
Choose an attribute to show. Here we use “show location only”
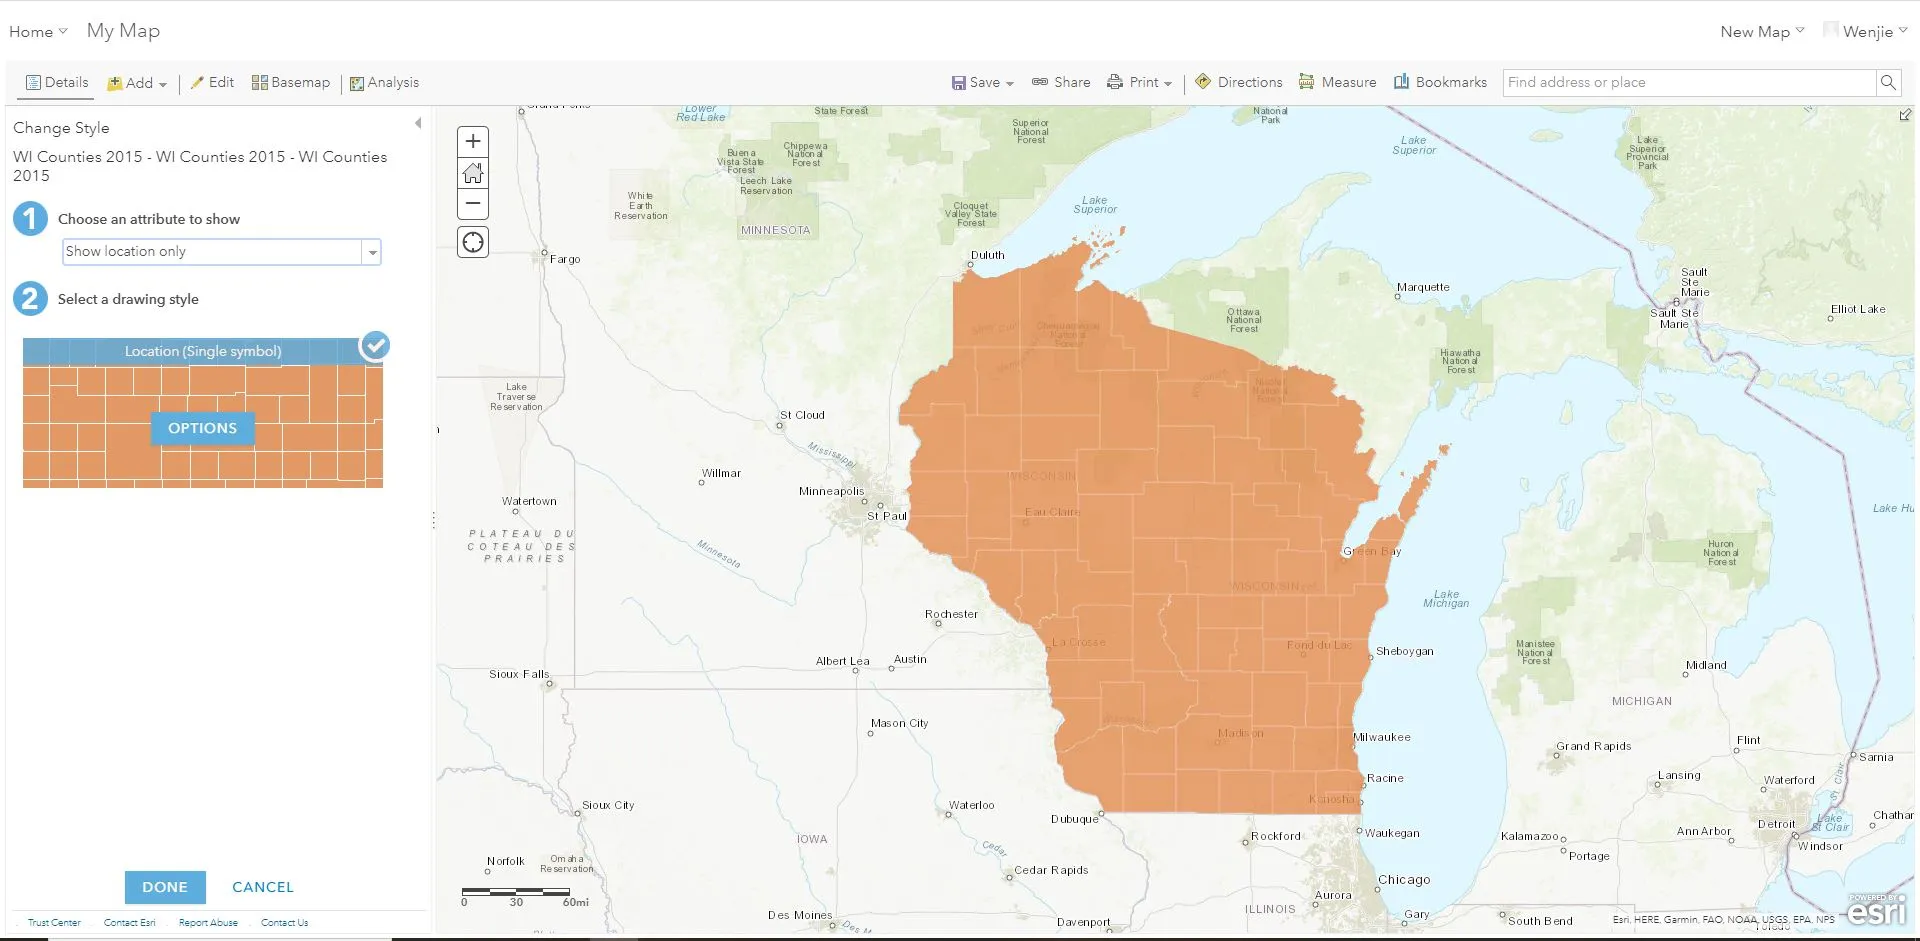
-
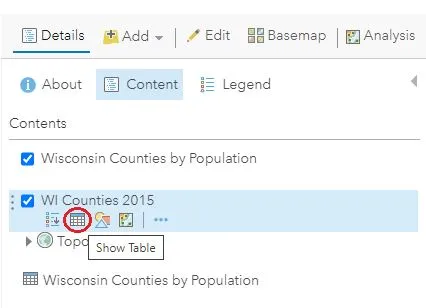
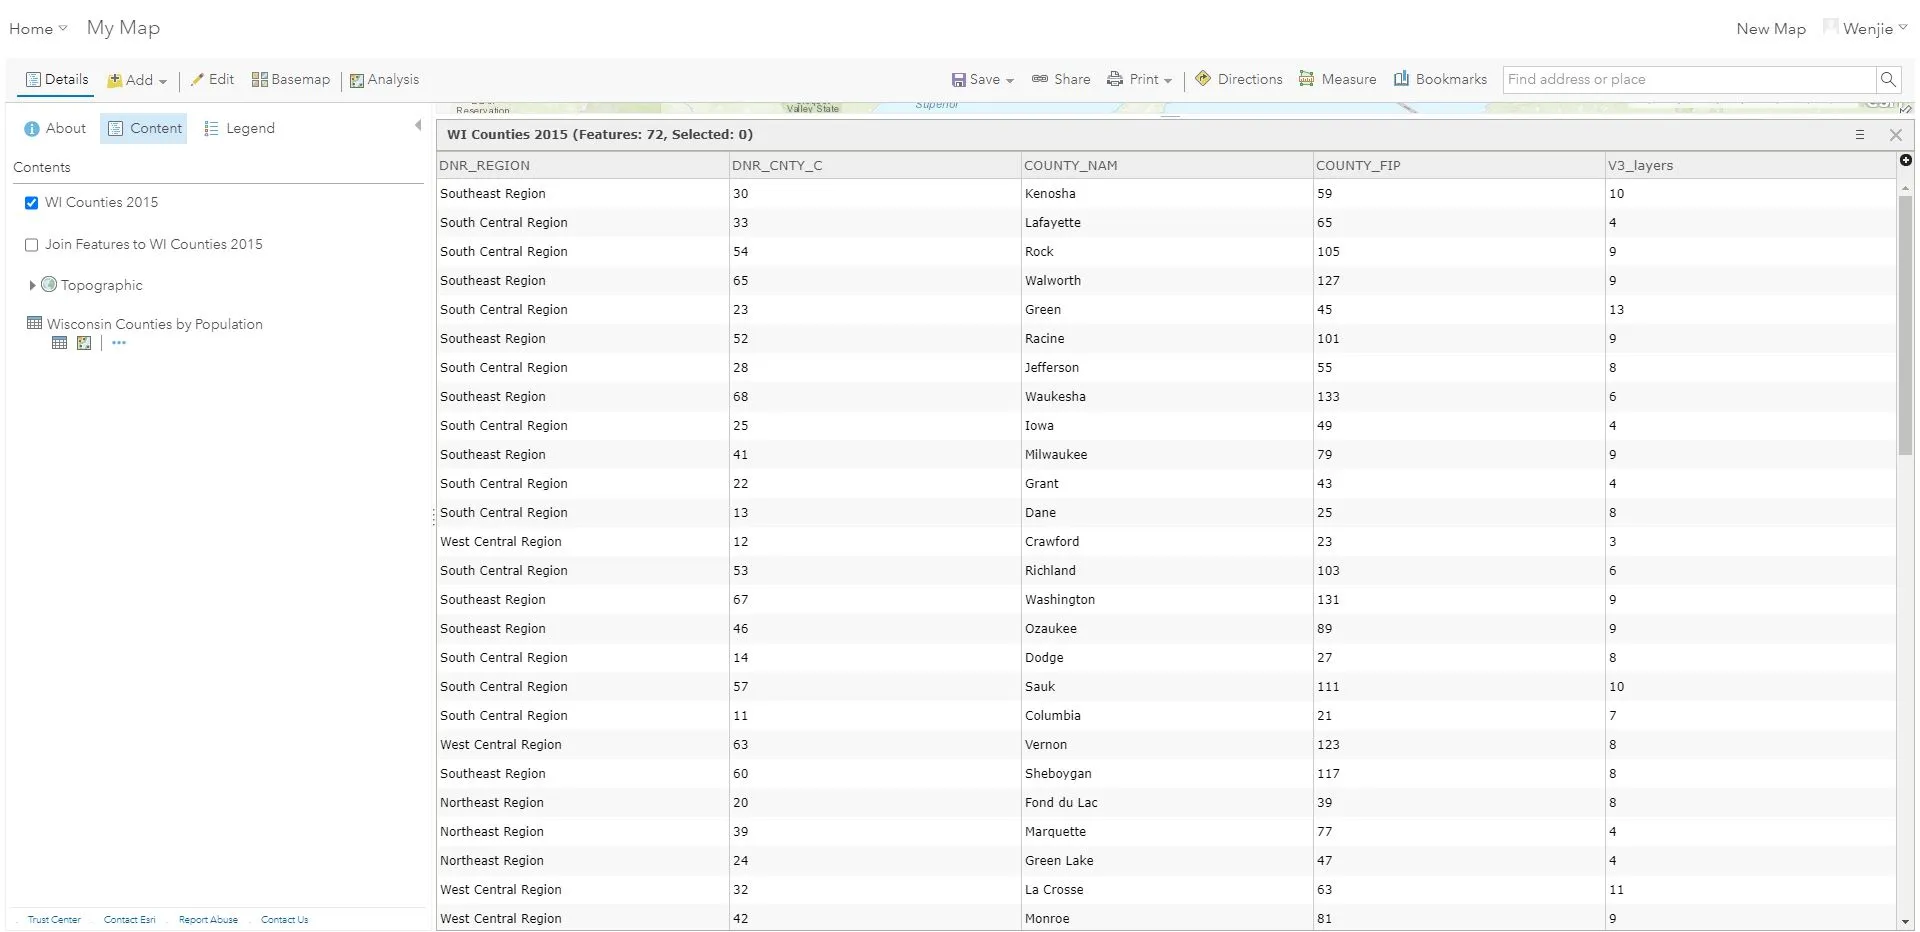
Click “show table” button to open attribute table and get to know what information was included in the geospatial dataset.
-
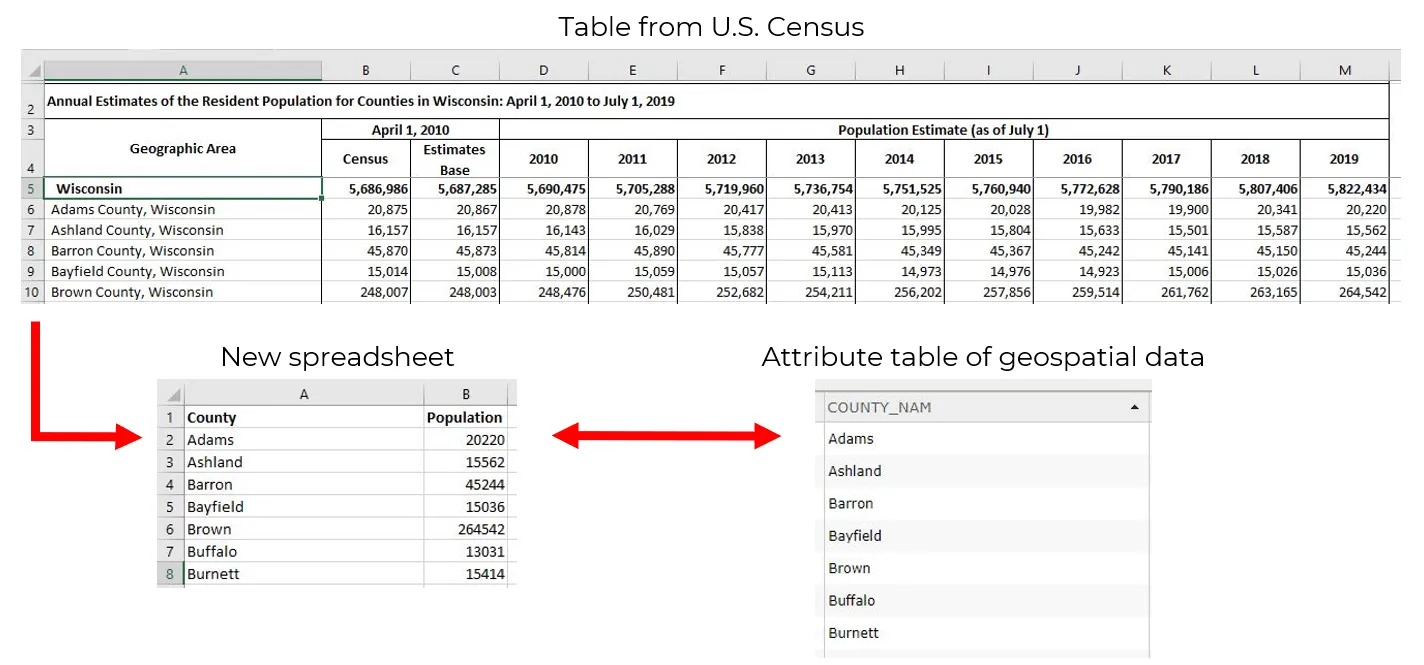
Create a new excel file and name it as “Wisconsin Counties by Population.csv”. Copy and paste the county name column and population in 2019 column from U.S. Census spreadsheet into this new excel file. We need to use county name as the common field to link those two tables. Therefore, the name of counties in both table should be the same.
-
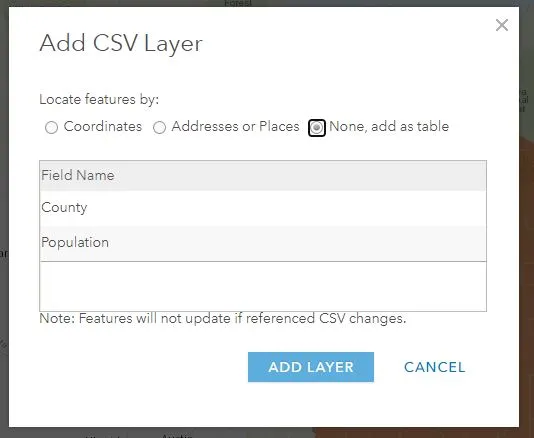
Add the “Wisconsin Counties by Population.csv” as a new layer and choose “None, add as table”
Data Process
Section titled “Data Process”The following steps show how to link tabular data to the geospatial data:
-
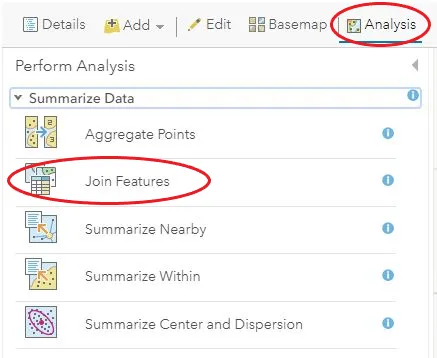
Click Analysis and choose Join Features
-
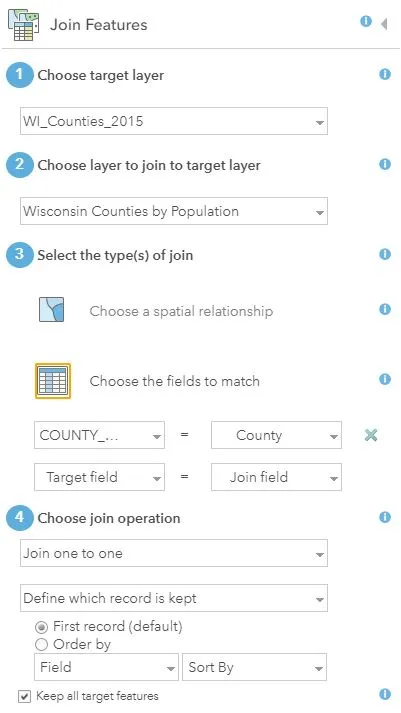
Choose WI_Counties_2015 as the “Target Layer” and Wisconsin Counties by Population as the “Layer to Join to the Target Layer”.
-
Choose the “COUNTY_Nam” and “County” as the fields to match.
-
Choose a one-to-one join operation and name the result layer as Wisconsin Counties by Population.
-
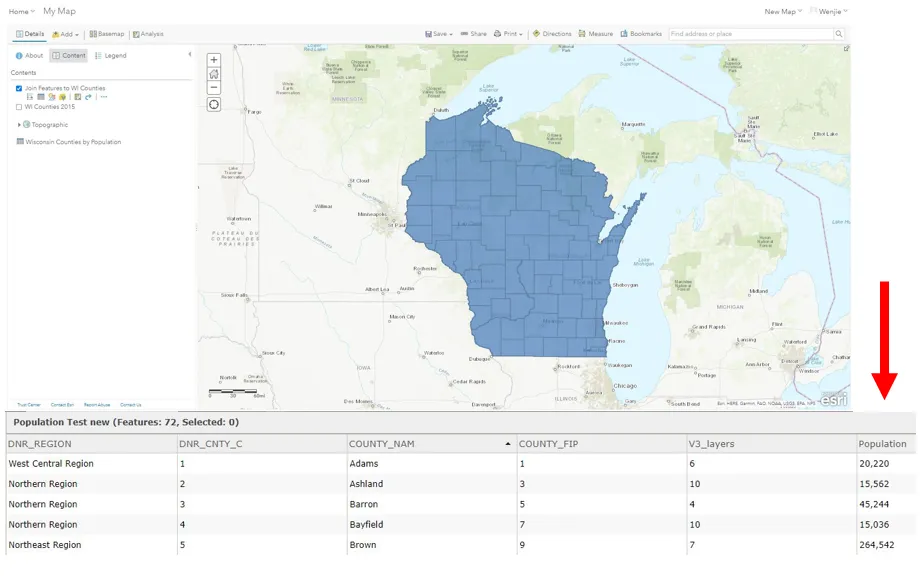
Click the Run Analysis button, and a new layer based on population will be shown.
-
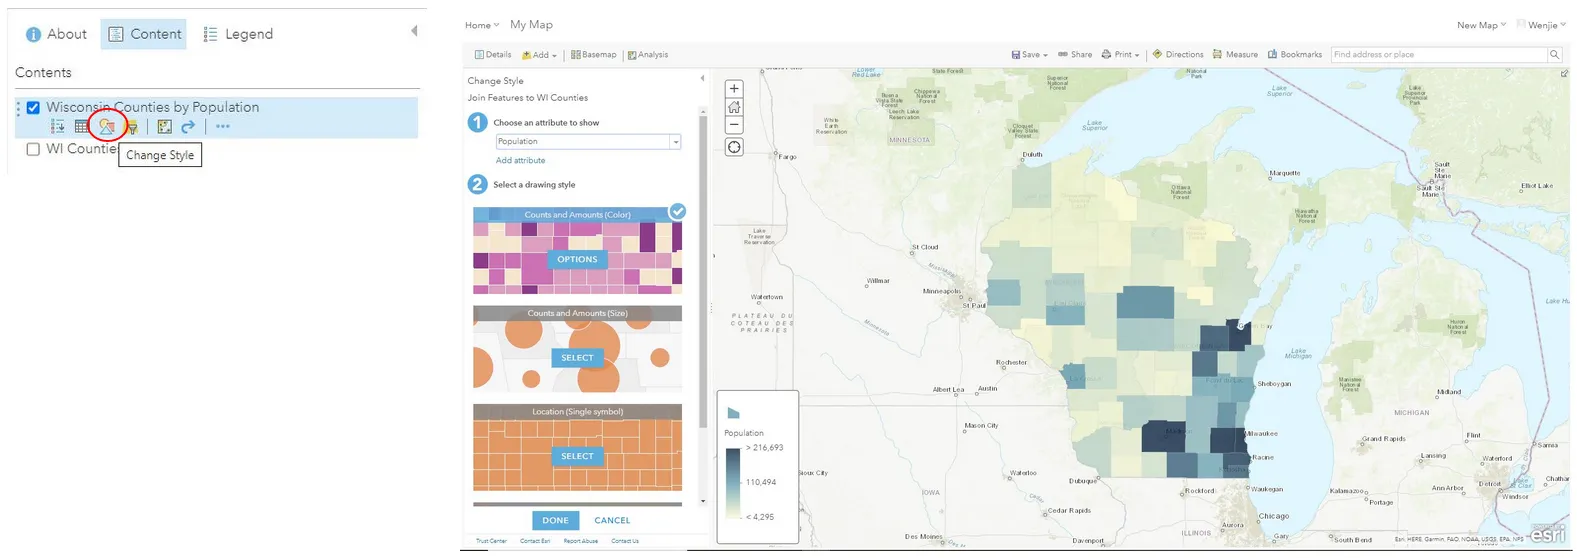
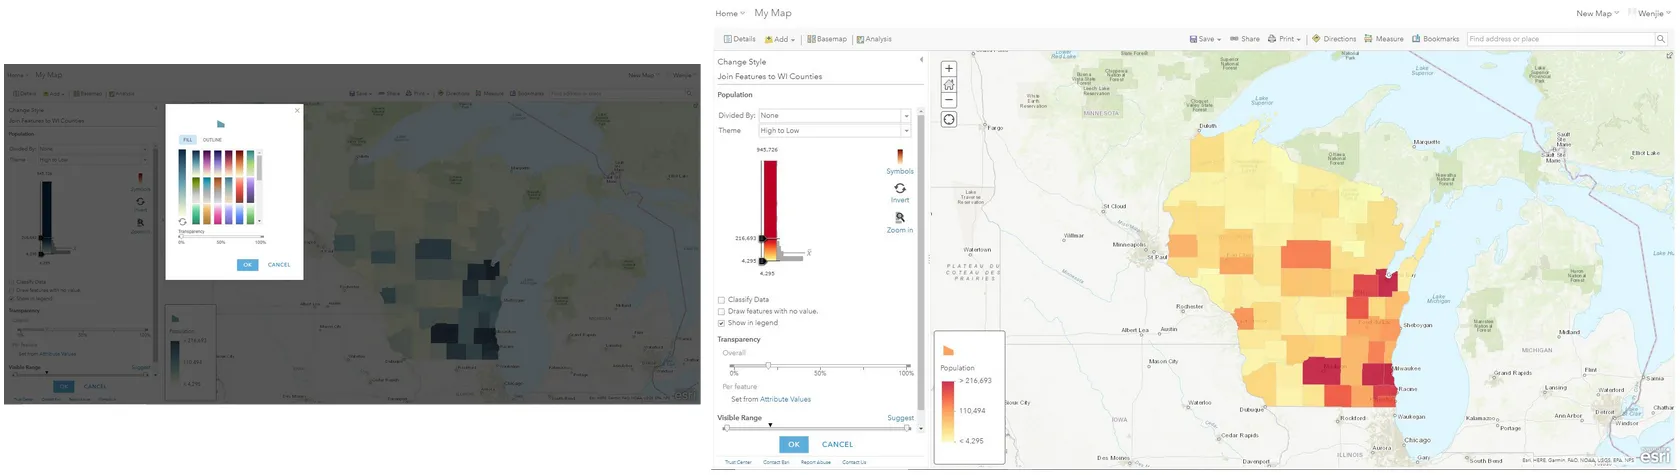
Symbolize the Wisconsin Counties by Population layer by clicking “change style” button
-
Choose the appropriate style to clearly show the population
-
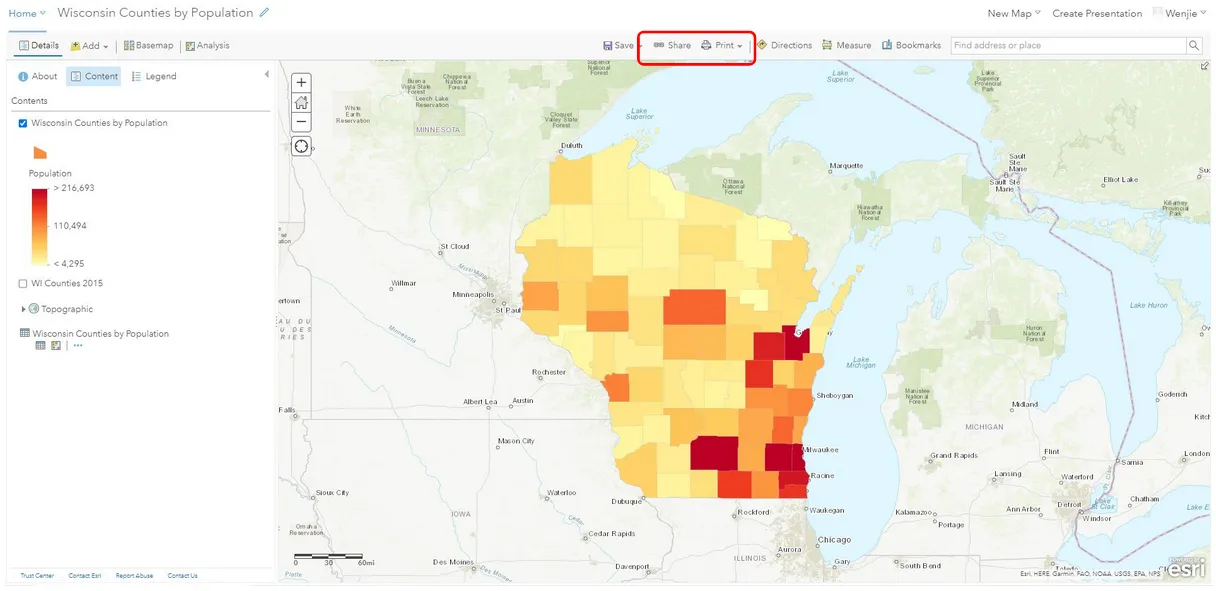
Share or Print the Wisconsin Counties by Population map.
-
For copyright information, refer to the copyright tutorial.
Exercise
Section titled “Exercise”-
What’s the advantage of mapping tabular data?
-
Choose a different basemap and use a different symbol to create different thematic map.
-
Download a shapefile data related to students’ research field and link their tabular data to it.